You Need to Know About Your Flight
Due to some interactive visualization graphs, we strongly recommend you to use a computer’s browser to read this article.
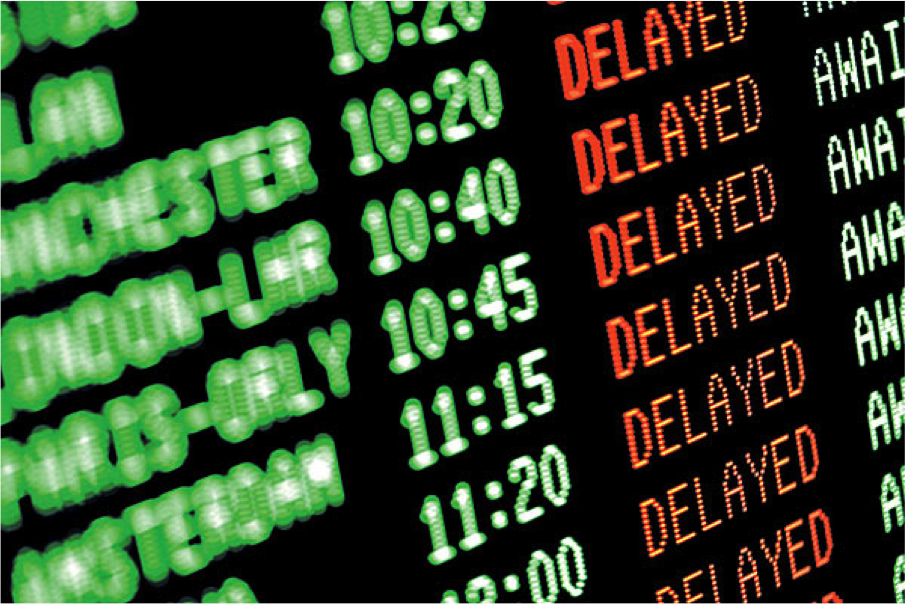
For many times, I get delayed for my flight due to multiple reasons: weather, carrier, security, etc. I never thought of why and what exactly happened for the flights and airports across the United States until I go through the flight data for the past years. I feel there is a strong need to visualize and discuss the insights for the delays that every one of us encountered before.
Department of Transportation’s flight data starts from a while ago, but I am not planning to use all of them. Instead, I choose the data from 2011 which is the first year I came to United States. Let’s first take a look at some facts throughout these years.
Airport Delays over the 5 years
The first thing come to my mind is the most busy airport in US. To be more specific, I split it into two parts: departure and arrival. To be honest, it is quite surprising to realize that Atlanta GA is the busiest airport for the past five years though Chicago IL is understandable. Another interesting phenomenon is the departure and arrival popularity is not identical for those big airports. That raise a flag that there might be something interesting about the asymmetry.
Next, you might wonder the worst delay should happen in either Atlanta or Chicago. If we consider the Delay Ratio as the number of flights delayed divide the total number of flights, then neither of them are the the worst airport in the US. In contrast, Atlanta airport is pretty efficient with only around 35% delay ratio comparing to Denvor’s 48%. But it worth knowing that Denvor and Las Vegas might get you delayed in a roughly 1 out of 2 flights.
To breakdown the delays, interesting stuffs start coming onto the surface. We used to hear from the airlines that we are delayed or canceled because of the weather. However, the data below tell you a different story. The biggest cause for delay (including departure and arrival) is Late Aircraft. That means the plane is late coming here. So we might think why it is late? Does it come late because of the weather over there? I doubt this to be true because all those airports share the same pattern without being affected by the weather. The second cause is the NAS which I really doubt the efficiency of the system to handle so many planes in the air or need to be in the air.
Lastly, we aggregate the delays to display the average monthly delay for airports during the last five years for each airport. The following interactive graph may give you a sense of how the delay ratio changes within a year. You may already noticed that the ratio dynamics are very different from airport to airport, though a general pattern is Christmas and summer time (both are good time to travel). But there should be a lot of conclusions you can draw from the chart. We do notice some interesting points as well which we will put in the next few blogs in details.
Airlines Delays over the 5 years
Airport is one of the important factors of your flight’s delay, but airlines could play more in the role. So we use the same approach to look into the top 10 busiest airlines in the United States for the past 5 years which we believe are your choices for most of your flights.
For those of you not familiar with the airline code, you can either google it or simply try this link from Wikipedia. Surprisingly, Southwest Airline is the busiest one in United States. I am not very familiar with the details of the current competitions among airlines, but I have never tried Southwest before. Maybe I should try it.
The airline delay ratios roughly have the same pattern as airports. The departure delay and arrival delay are very close to each other. Southwest and United Airlines have roughly 50% delay ratio which is way too high. Comparing to Alaska Airlines, these two will make me crazy if my flight get delayed every other time.
If we breakdown the delays, weather seems to be a bigger factor comparing to airport’s issue. Essentially, data comes from the same source but with different grouping method, so I am thinking of what this grouping changed? Maybe some airlines cover mostly better weather airports or so. However, NAS and late aircraft are always the two big issues. Thus my next blog should be on the analysis of why those two factors always.
Finally is the interactive visualization of each airline’s delay over the past five years. We aggregate the data monthly and there are some interesting dynamics in the visualization you can discover as well.
Route Delays over the 5 years
To visually display the top frequent air route in the United States, we have a chord diagram below which connects the most frequent routes. From the diagram, one thing you can easily observe is that Los Angles is an interesting place because it is the hub of 5 most frequent air routes. What a busy city, isn’t it? In addition, Phoenix, AZ is one of the origins and destinations as well, but I never make a stop there excepting driving through. Maybe you have more thinkings of this.
Air route delays definitely show a different pattern. Late aircraft is no longer the biggest reason. However, NAS becomes a more substantial factor. One idea I do have right now is that those frequent routes connect ciities usually being a start or end city, which means there is no need to wait for the aircraft because it is the first one. Plus, most of them have direct flights which make things easier again.
In the end, we also provide the monthly route delay ratio curves so that you can play with it and find more interesting insights into it.
The End
As you may have seen, there are so many insights and questions about our flights and why we have delays. Apparently, we could not cover all of the analysis in this single article. Nevertheless, we will continue providing our insights through the data and build models to explain the delays, which hopefully will make some constructive suggestions to the airports and the public to think about our air traffic.
Feel free to comment below and join the discussion.